Take your time tracking data and turn it into beautiful insights: Timeneye now integrates with Microsoft Power BI.
We always stress how important it in not only to track your time, but also how to analyse where you spend it.
This is why we filled Timeneye with reports, recaps and progression charts. Today, we introduce a new update that we will sure all of us data nerds and business intelligence enthusiasts will love: the Timeneye integration with Microsoft Power BI.
This integration adds to our growing list of Microsoft integrations, which includes Timeneye's connections to Microsoft Teams, Microsoft Planner, Microsoft To Do, Azure DevOps, and Outlook Calendar.
How does the Timeneye + Microsoft Power BI integration work?
Thanks to this integration, you'll be able to use the data from your Timeneye workspace as a data source in Microsoft Power BI. Power BI lets you get your data from a wide variety of sources, like Excel, SQL server, as well as a ton of online services.
And among these online services, you can now add Timeneye as well.
How to use Timeneye as a data source
We have a full guide on how to get data from Timeneye into Microsoft Power BI, that you can find at this link.
Basically, you will need to download a connector file and save it on your computer. You can do all this procedure from the Integration section of the workspace.
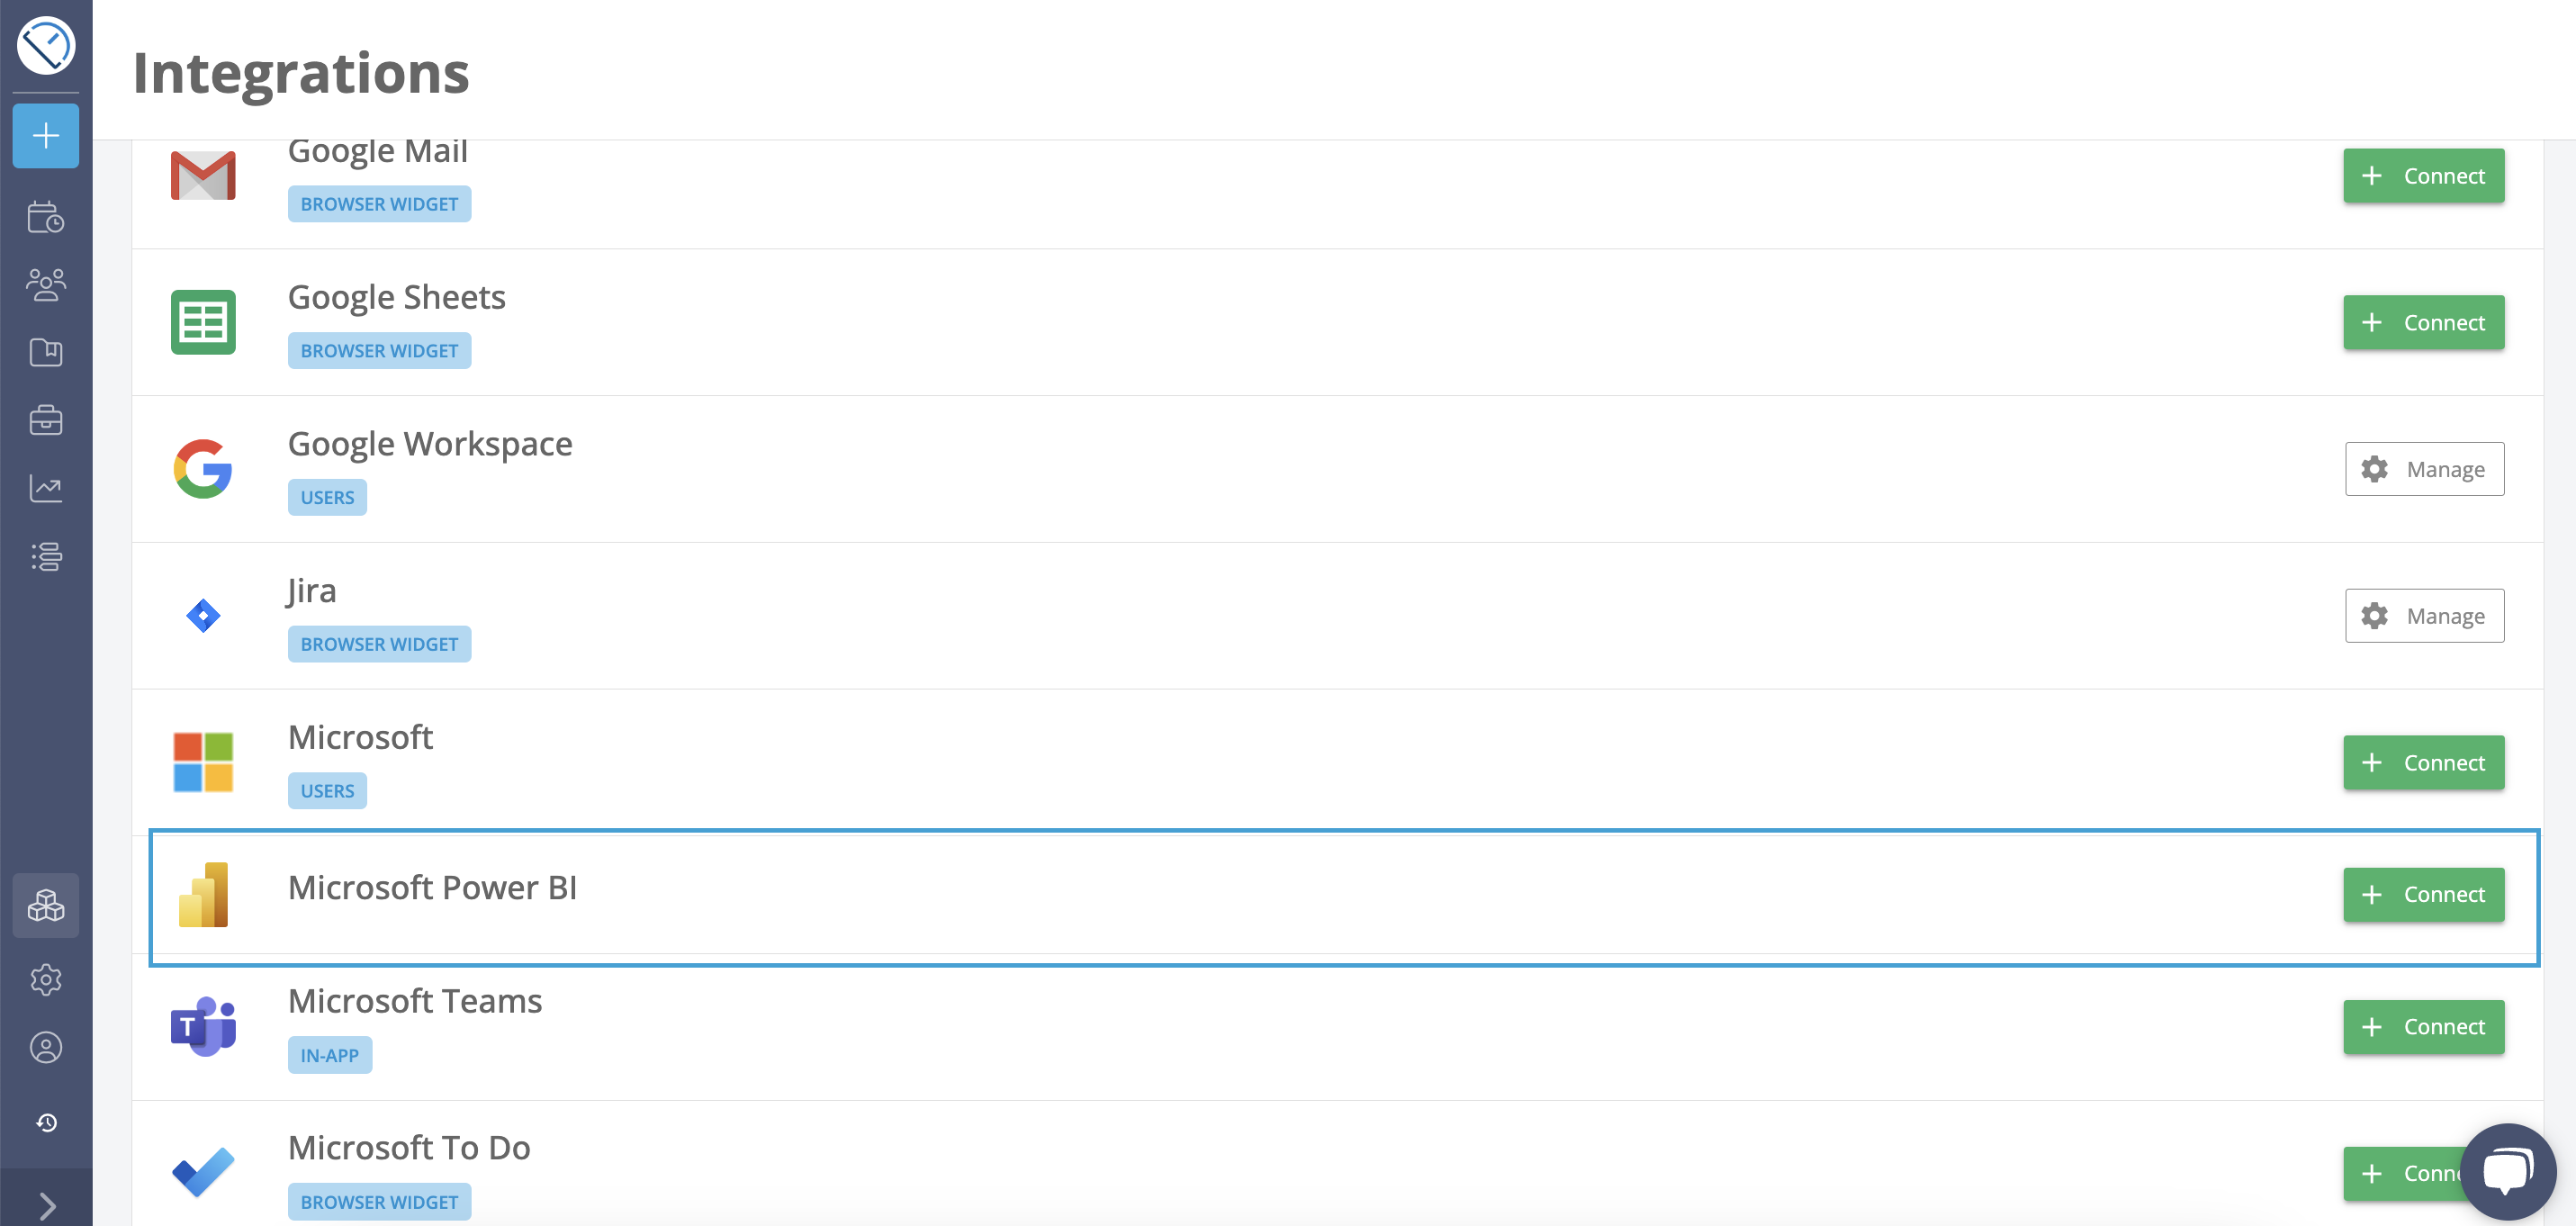
You can read the guide, but you will also find the steps explained on the integrations page as well.
After you have followed this procedure, you'll be able to select Timeneye as a data source for creating visual dashboards on Power BI.
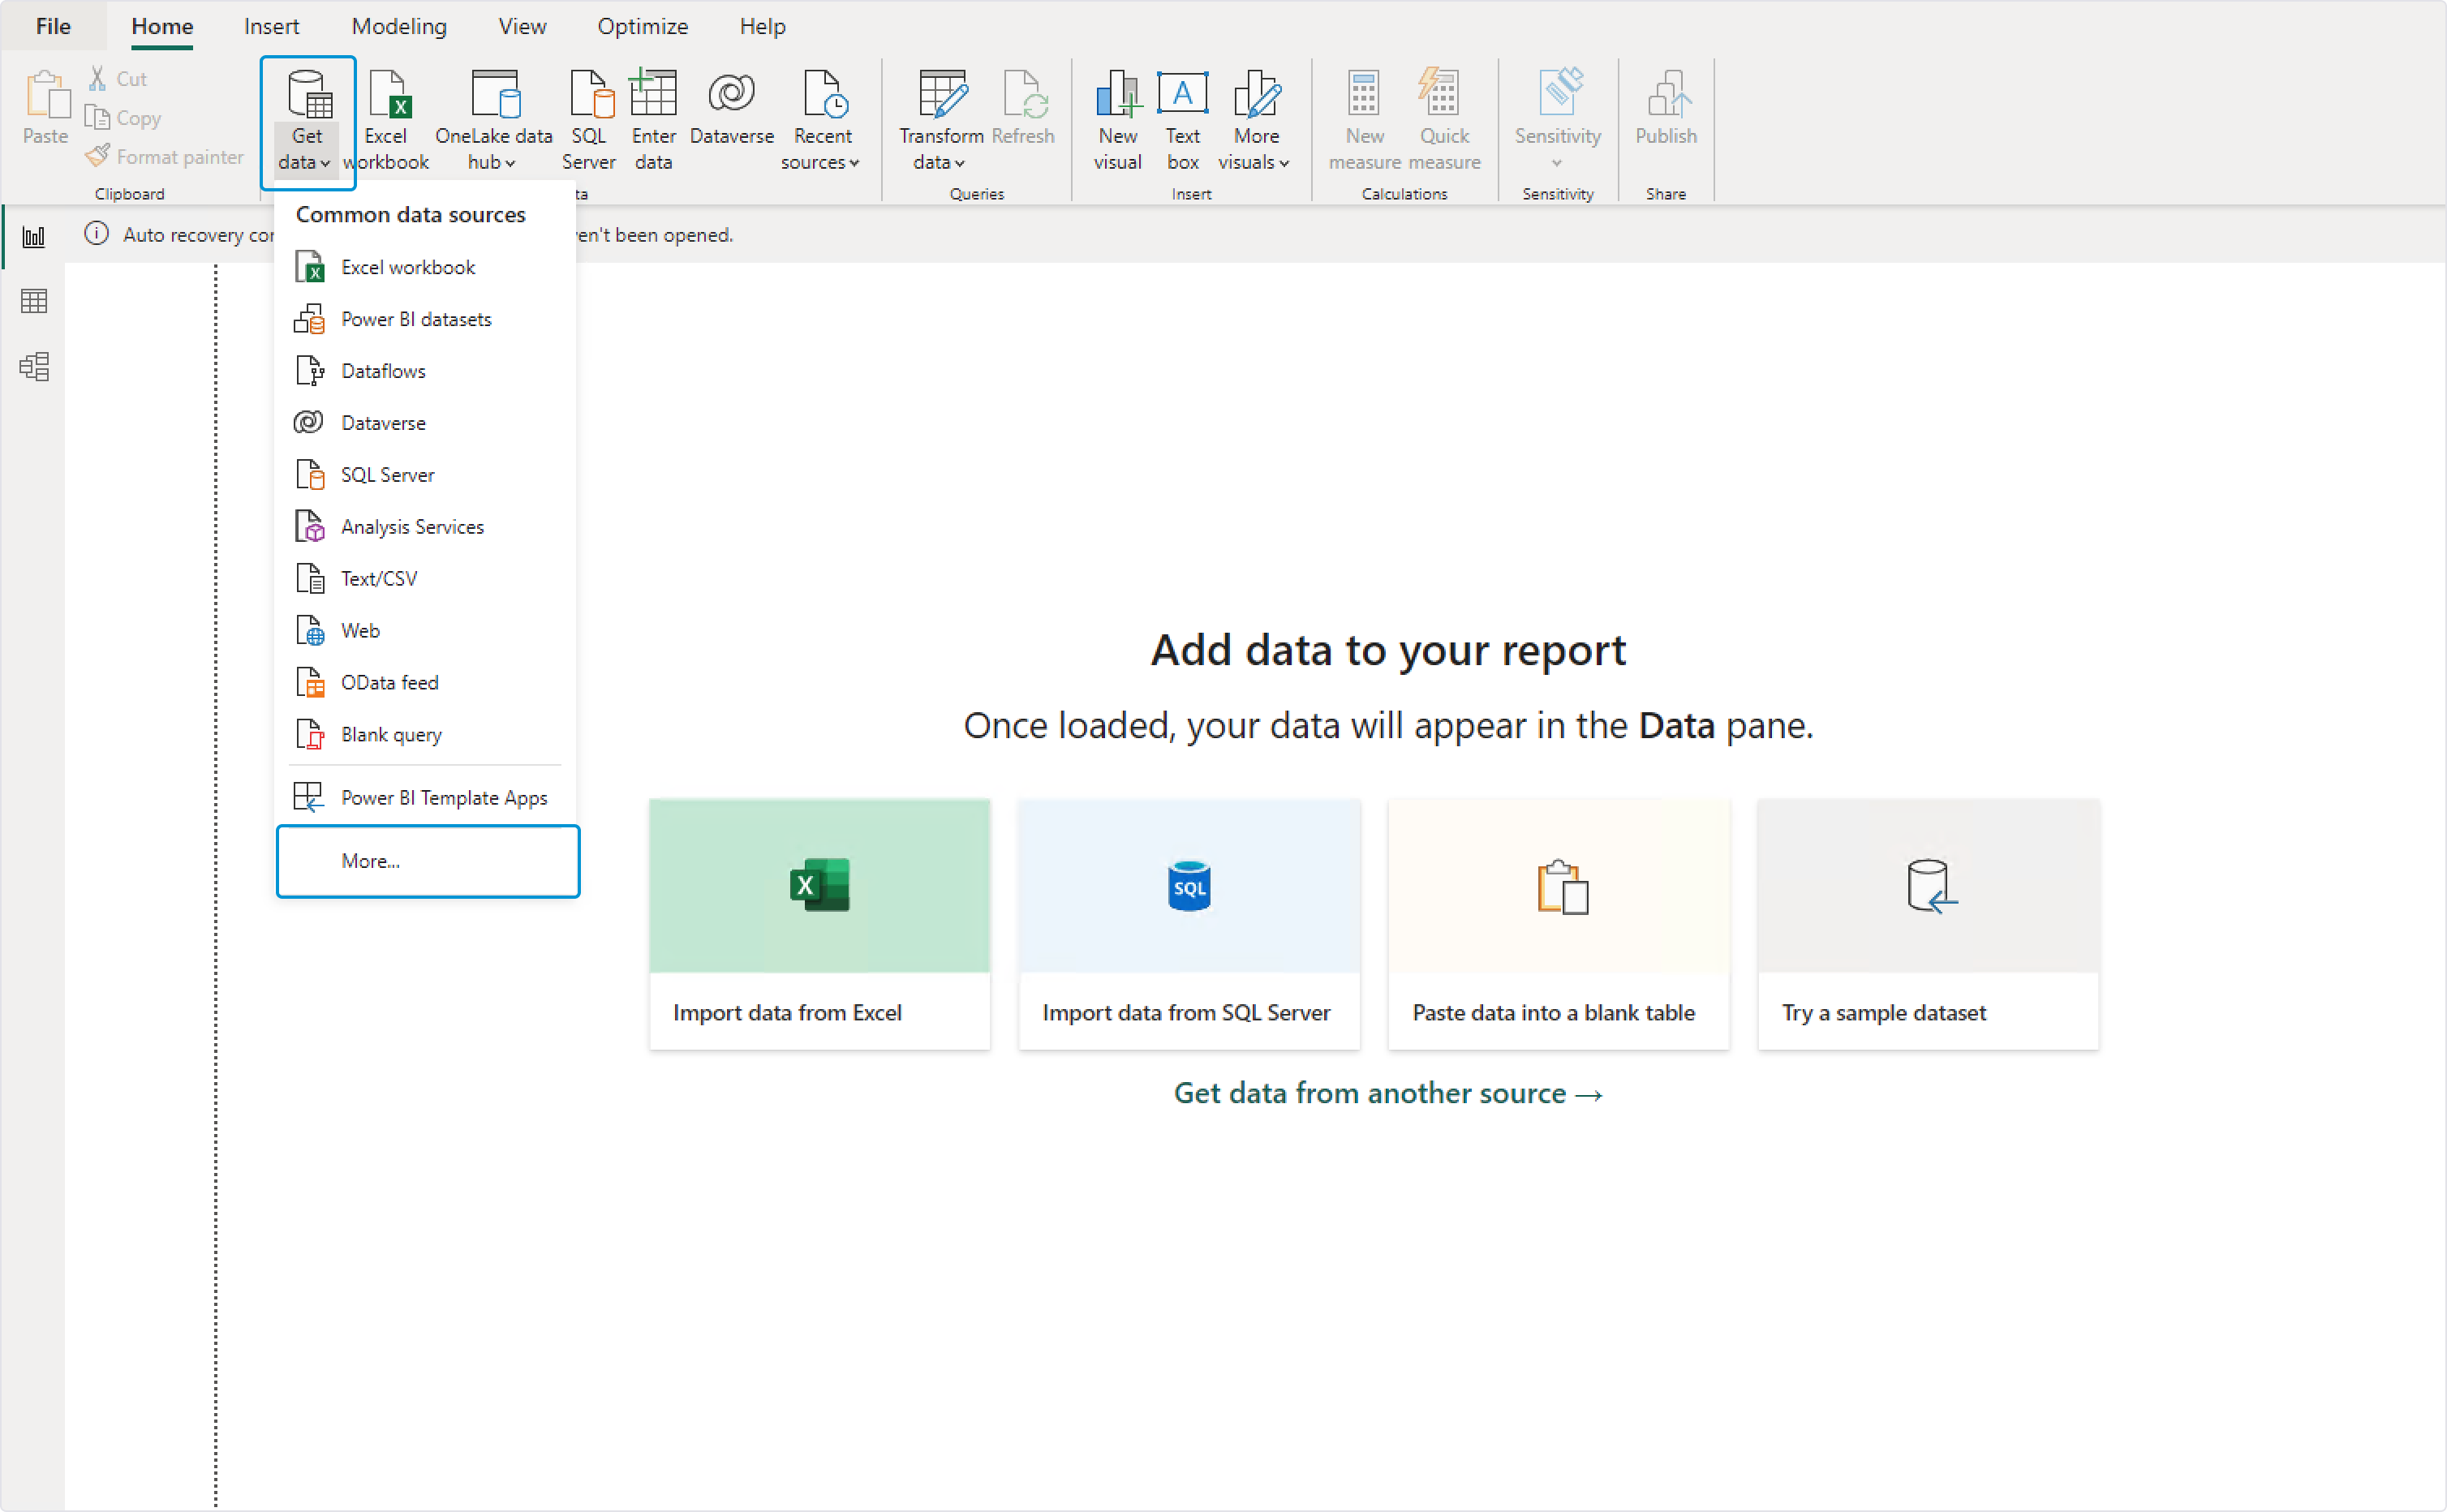
In Microsoft Power BI, click the "Get data" button, and then scroll down to find the "More "option.
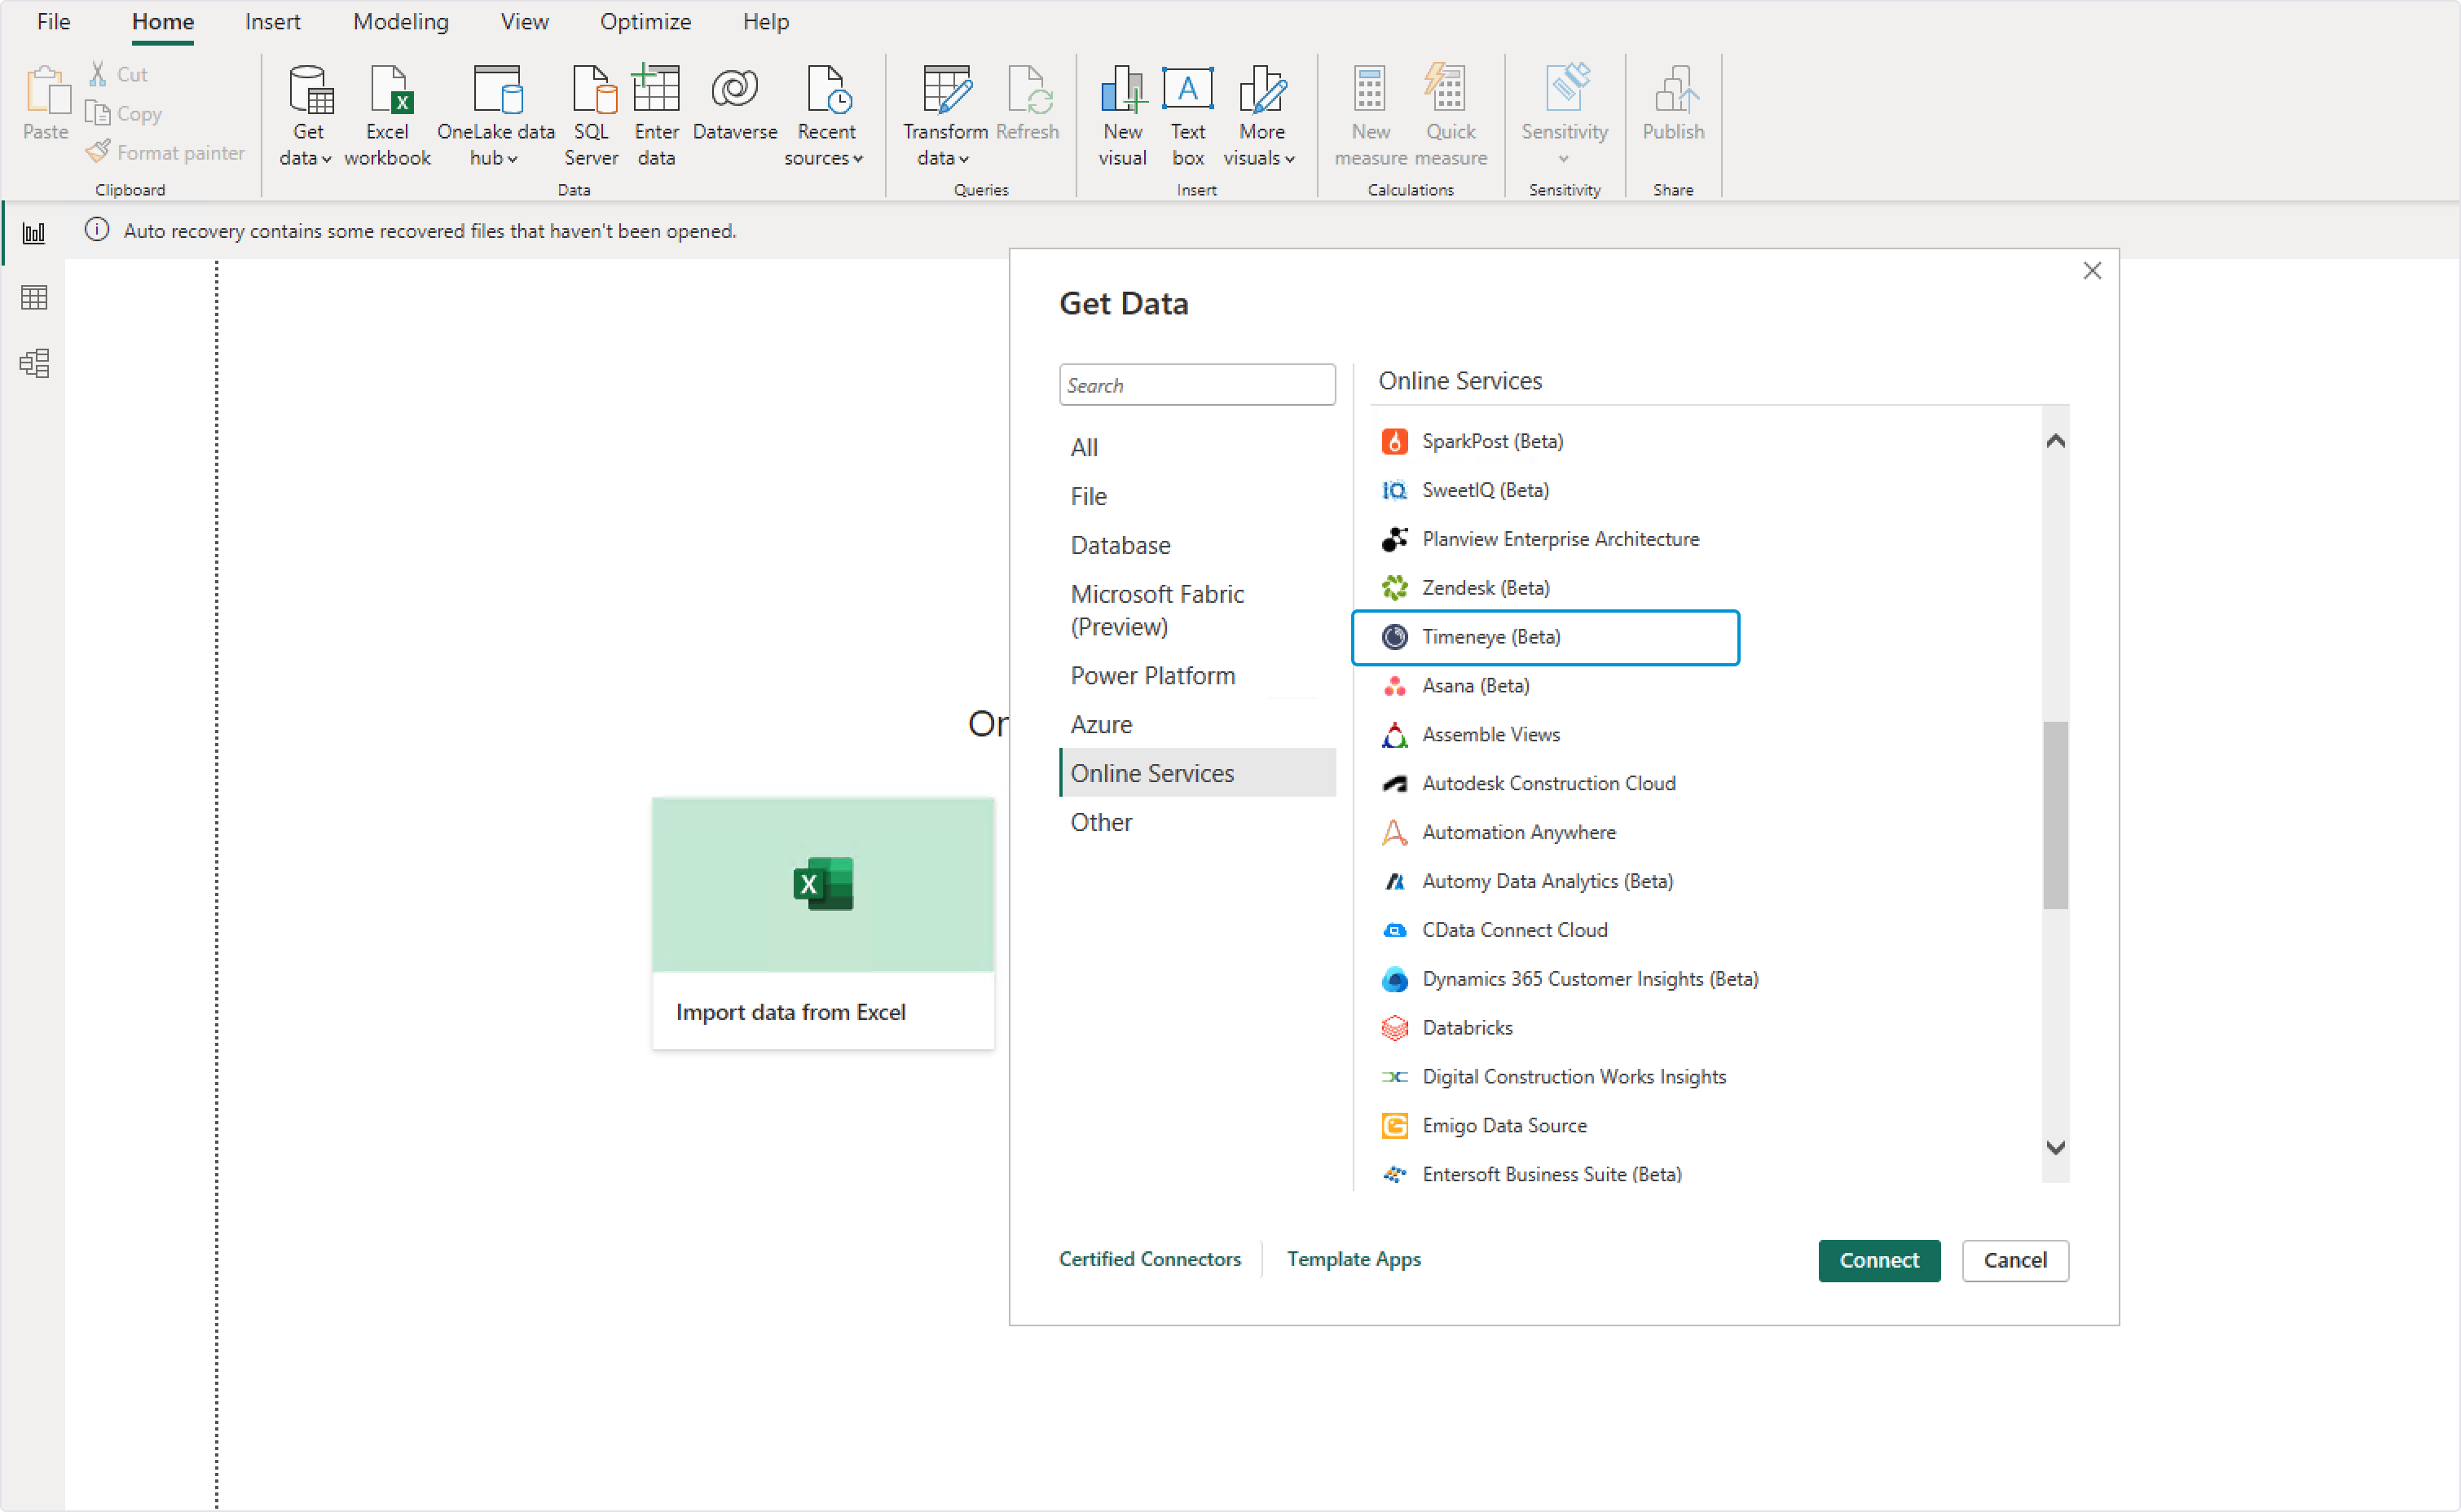
In "Online services", you'll find Timeneye:
Creating Visualisations
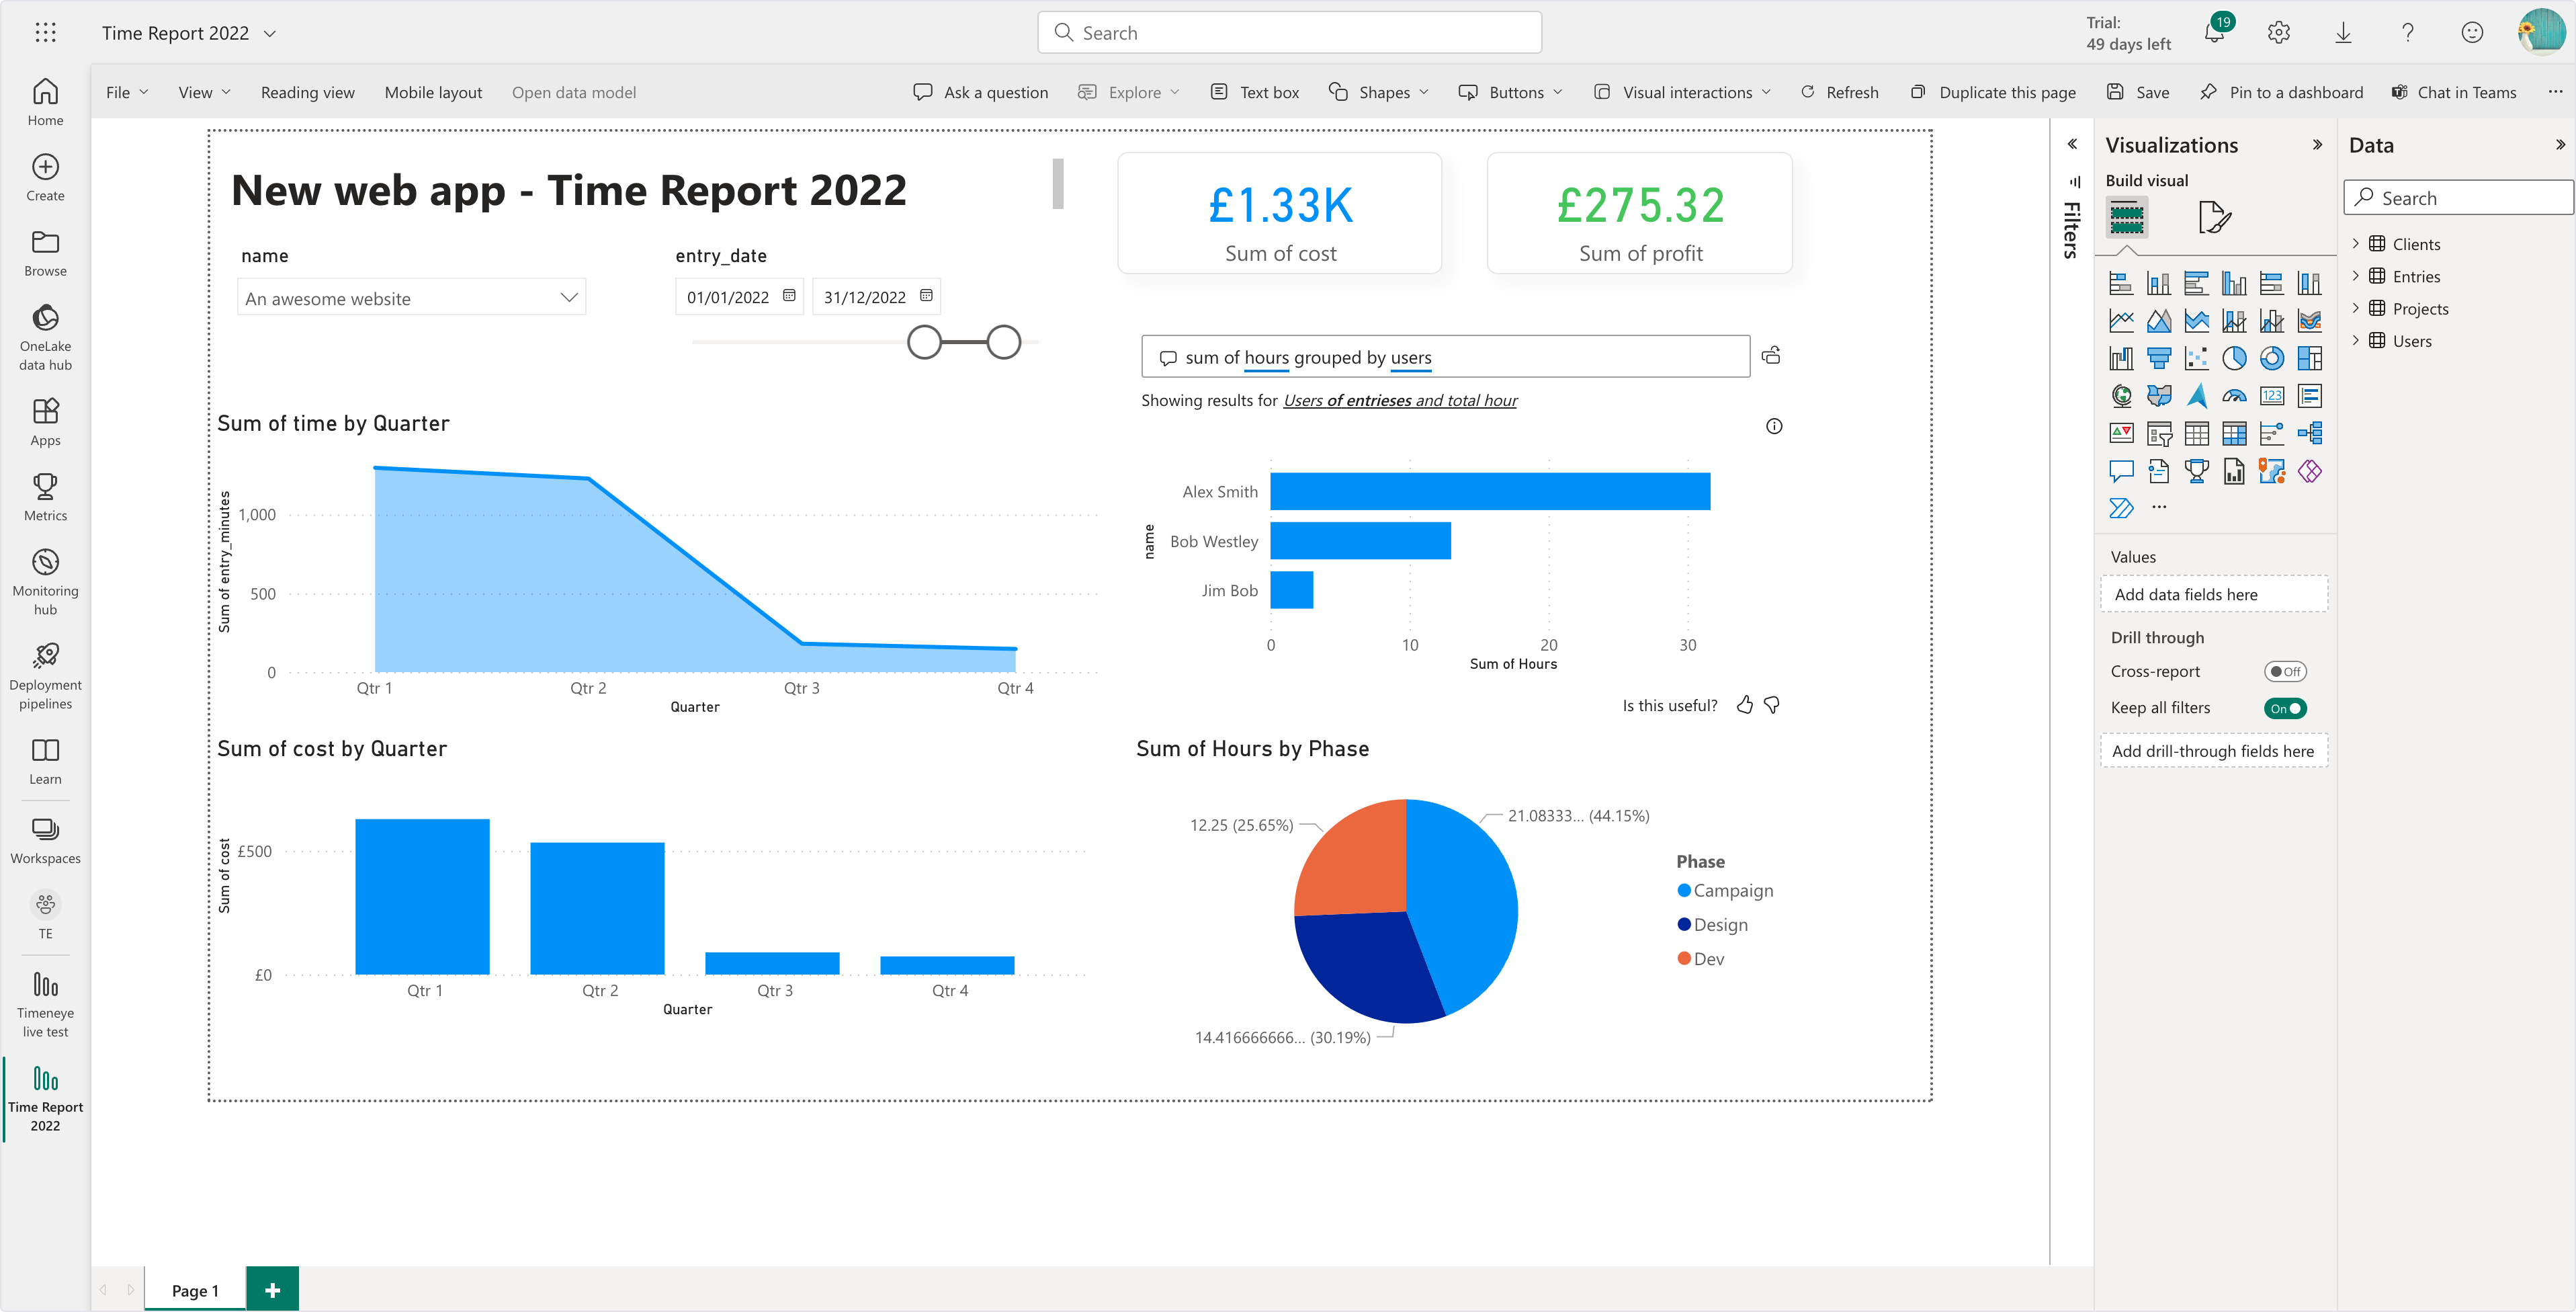
Once you have all your data ready, you can choose the best way to visualize it in a Power BI report. The Visualisations available range from the classic bar charts to a huge variety of other types of graphs.
The type of report you create will ultimately depend on the data you wish to analyze and the specific goals you have in mind.
For example, below we can see an analysis of a project (and its profitability) grouped by quarters:
Give this integration a try and let us know what you think!
Looking to track your time and create timesheets in other Microsoft Software? Don't miss out on the Timeneye integration with Microsoft Teams.
Are you new to Timeneye and just randomly found this article? Begin your journey with a free 14-day trial and dive into the world of time tracking, our extensive range of Microsoft integrations, and countless other exciting features.
